SIP: Wildfire VR Research
A walkable VR experience that moved wildfire risk awareness from 2.2 to 4.3 on a 5-point scale in a controlled study (p < 0.0001).
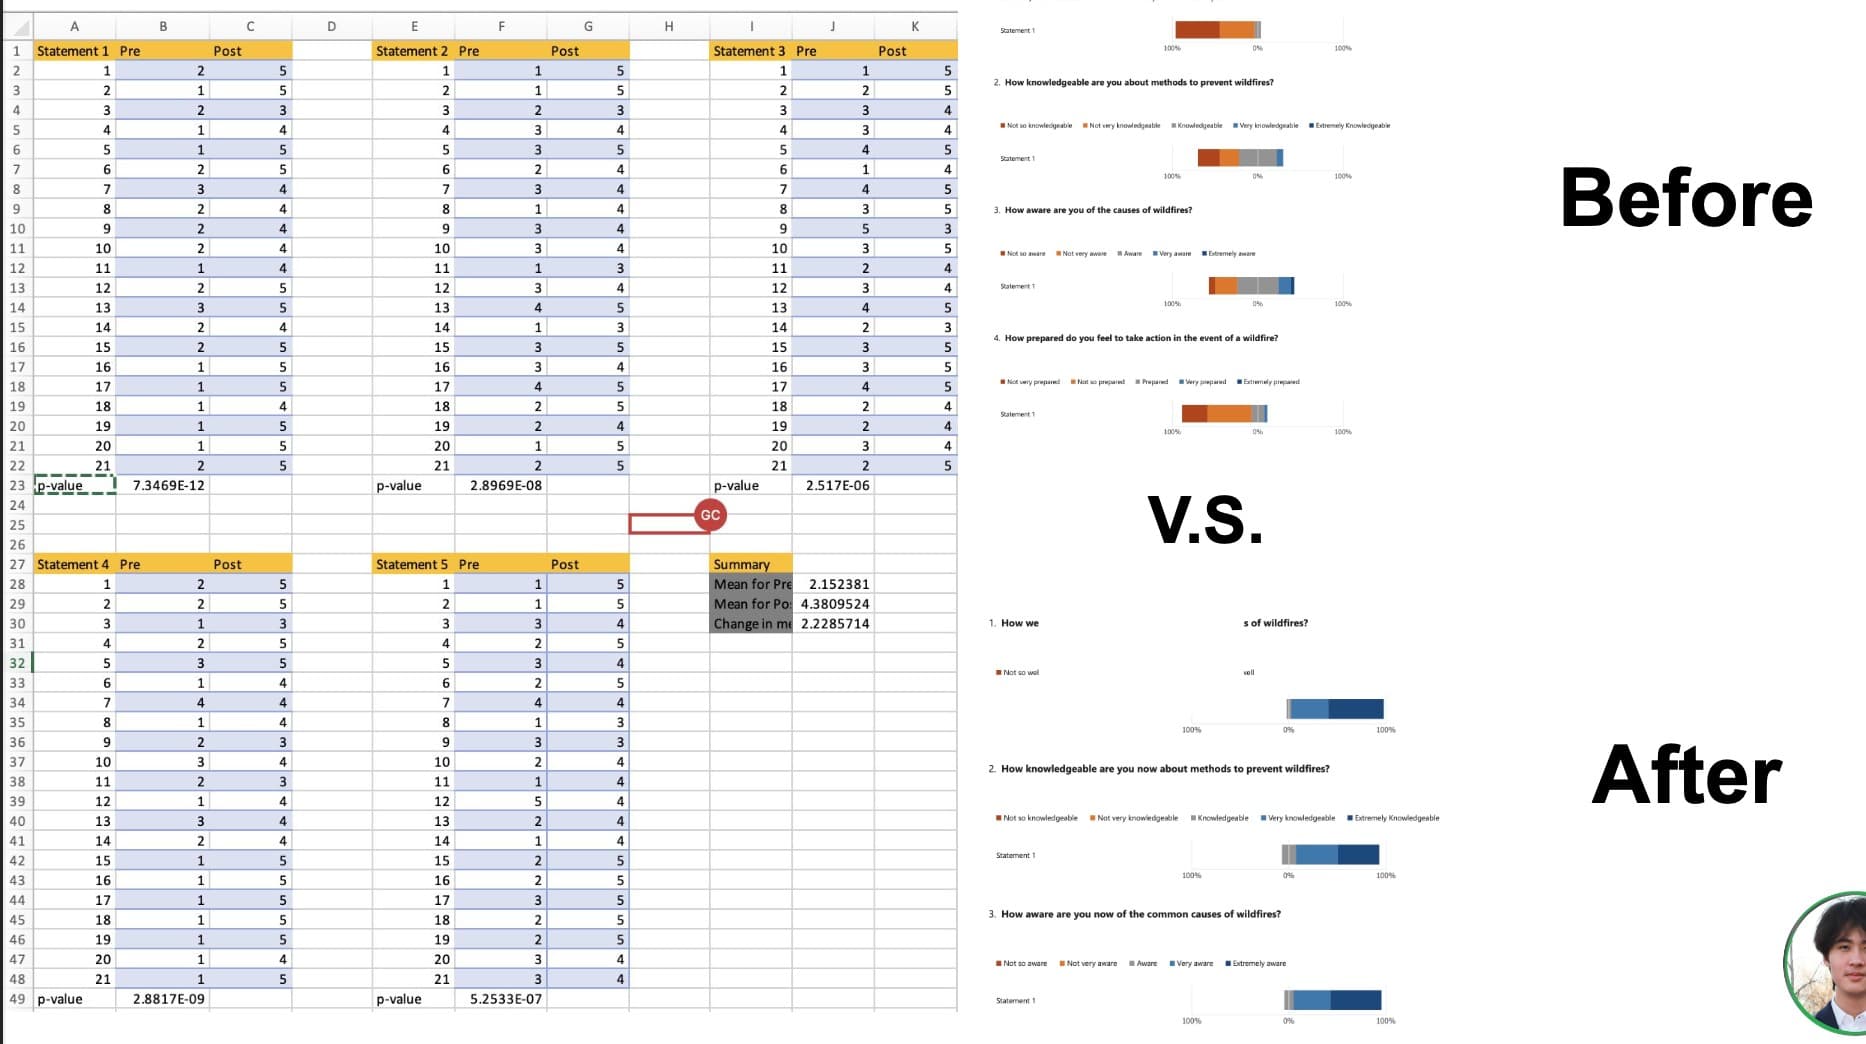
Wildfire risk in California is usually communicated as numbers on a page (acres burned, fire counts, drought indices), and the numbers don't land. For the UCSC Science Internship Program, I built an immersive, walkable VR world that turns those statistics into a first-person experience: viewers move through a thriving Central Valley landscape, watch it collapse into drought and wildfire, and then walk into a future protected by a proposed AI drone early-detection system I designed. I then ran a controlled pre/post study to test whether the experience actually changed what people understood and felt about wildfire risk. It did. Across 42 participants, awareness rose from a mean of 2.15 to 4.31 on a 5-point Likert scale, statistically significant at p < 1×10⁻⁴.
The goals
- ✦Turn abstract wildfire and drought statistics into something a person can physically walk through and feel
- ✦Go beyond depicting the problem, designing a concrete, technically grounded AI early-detection system and embedding it in the world as the proposed solution
- ✦Prove the medium works: measure the awareness shift with real statistical rigor, not assertion
What I did
- ✓Built a walkable, narrative-driven VR world in Styly structured as a guided three-act journey (thriving landscape, drought-and-wildfire devastation, AI-protected recovery), sourcing and color-correcting 3D assets from Sketchfab and engineering atmospheric transitions to drive the emotional arc
- ✓Designed a proposed drone-based AI wildfire-detection architecture: UAV platforms streaming multispectral, thermal, and environmental telemetry to a base station running AI fire-risk inference that dispatches suppression resources to flagged coordinates, then visualized the full system inside the world
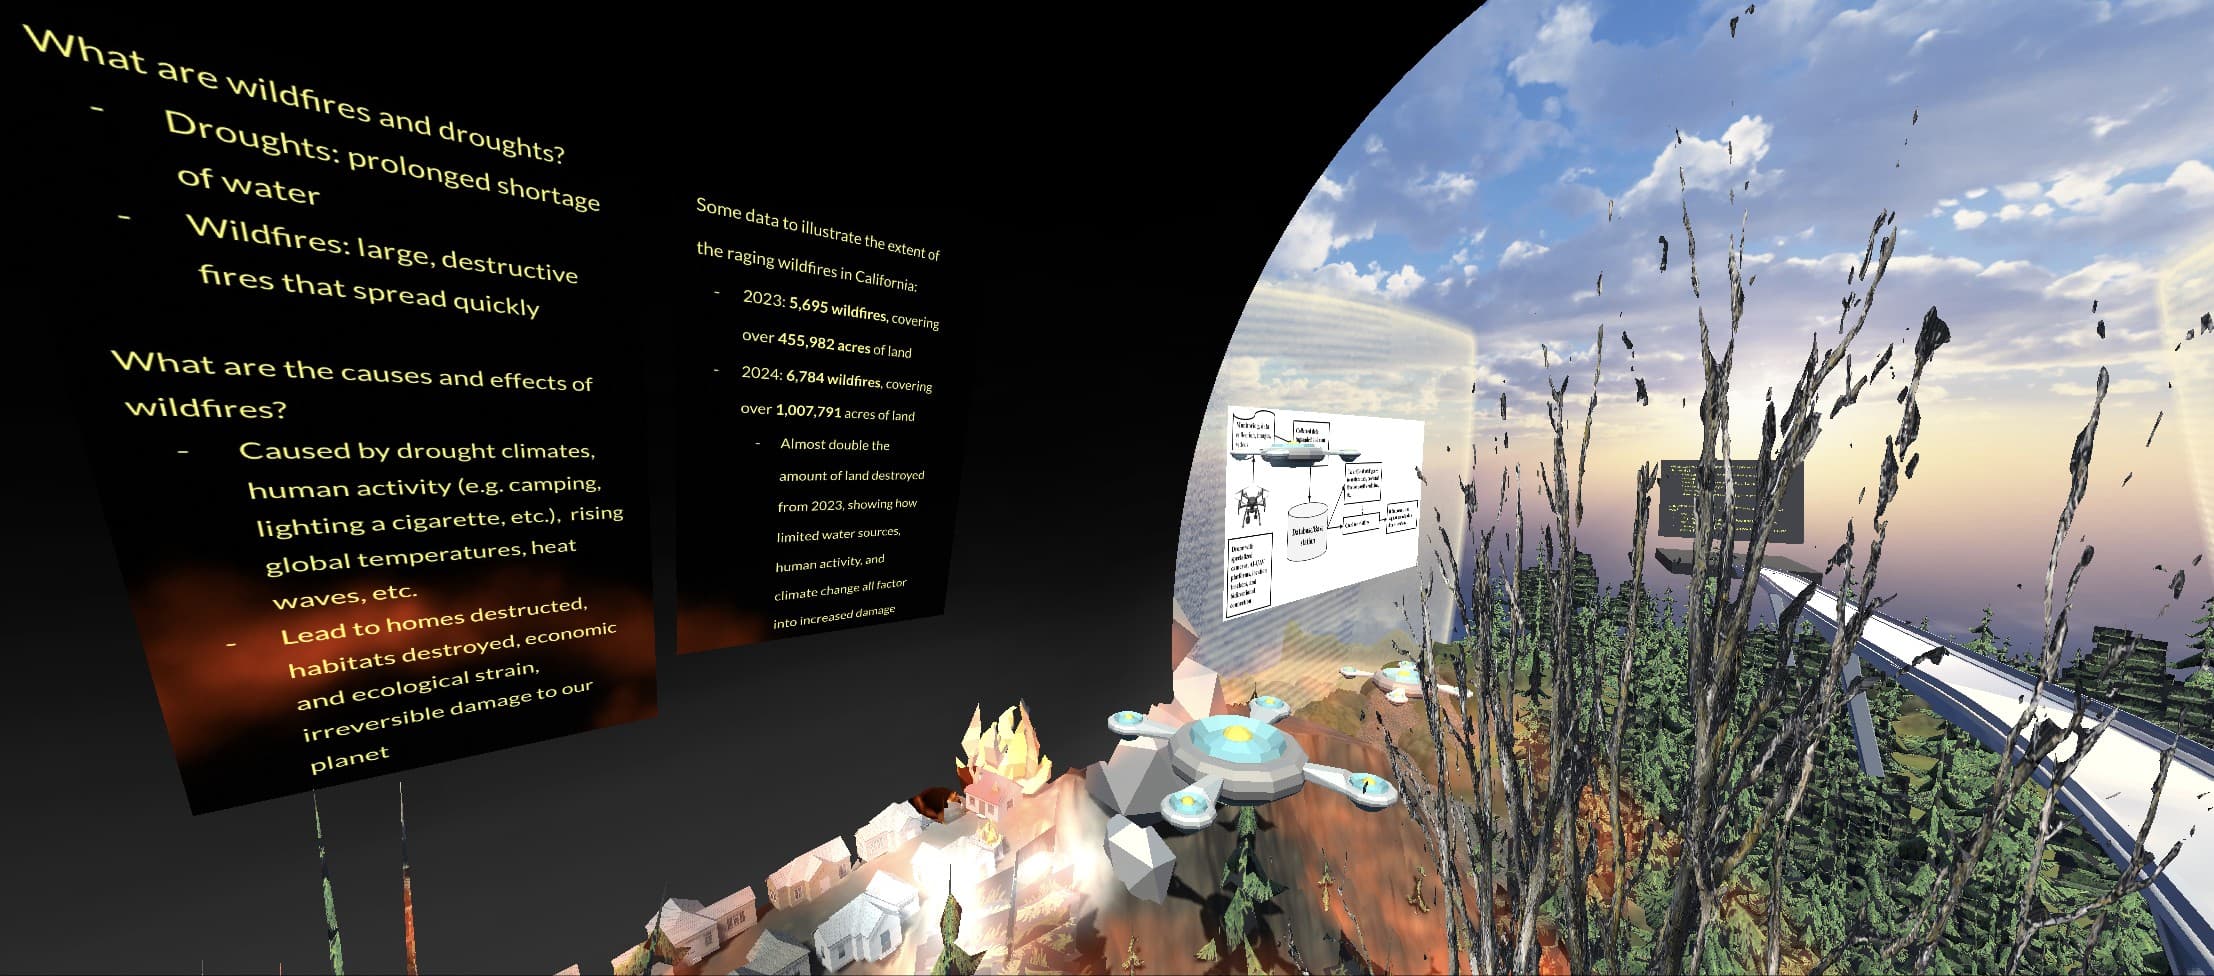
- ✓Embedded research-backed data panels and infographics along a transition tunnel (CAL FIRE wildfire-acreage statistics, causes, and ecological/economic impacts) so the world teaches as it immerses
- ✓Designed the study methodology and ran statistical validation: a 10-item, 5-point Likert instrument administered pre- and post-experience to 42 participants, analyzed with a one-tailed paired-sample t-test
What's inside
The narrative world
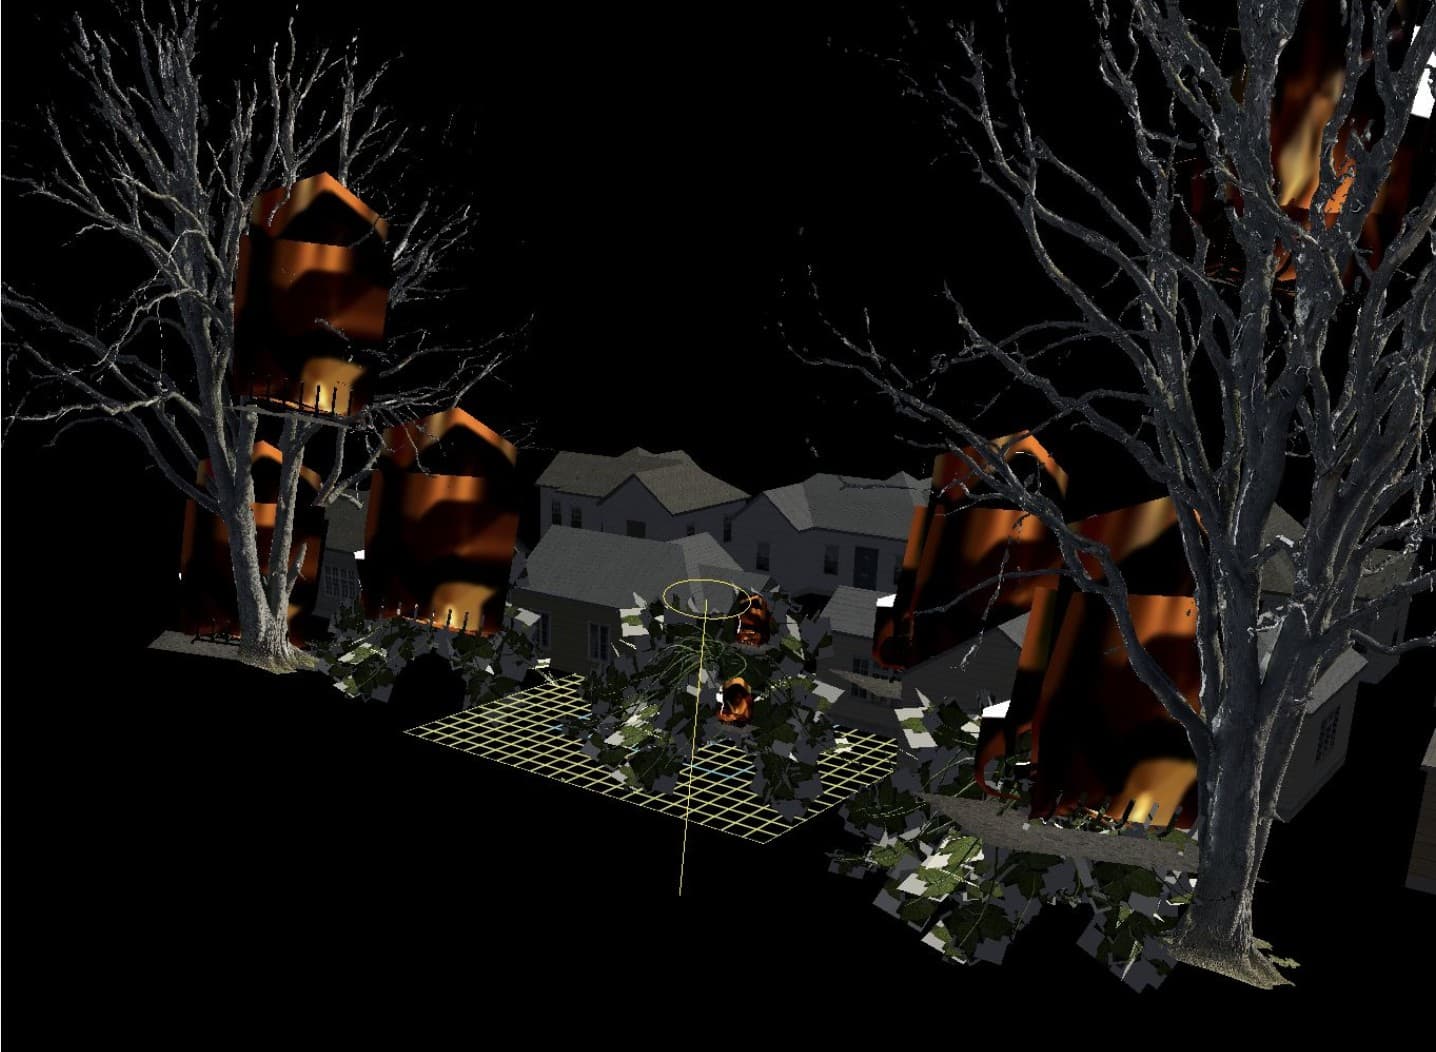
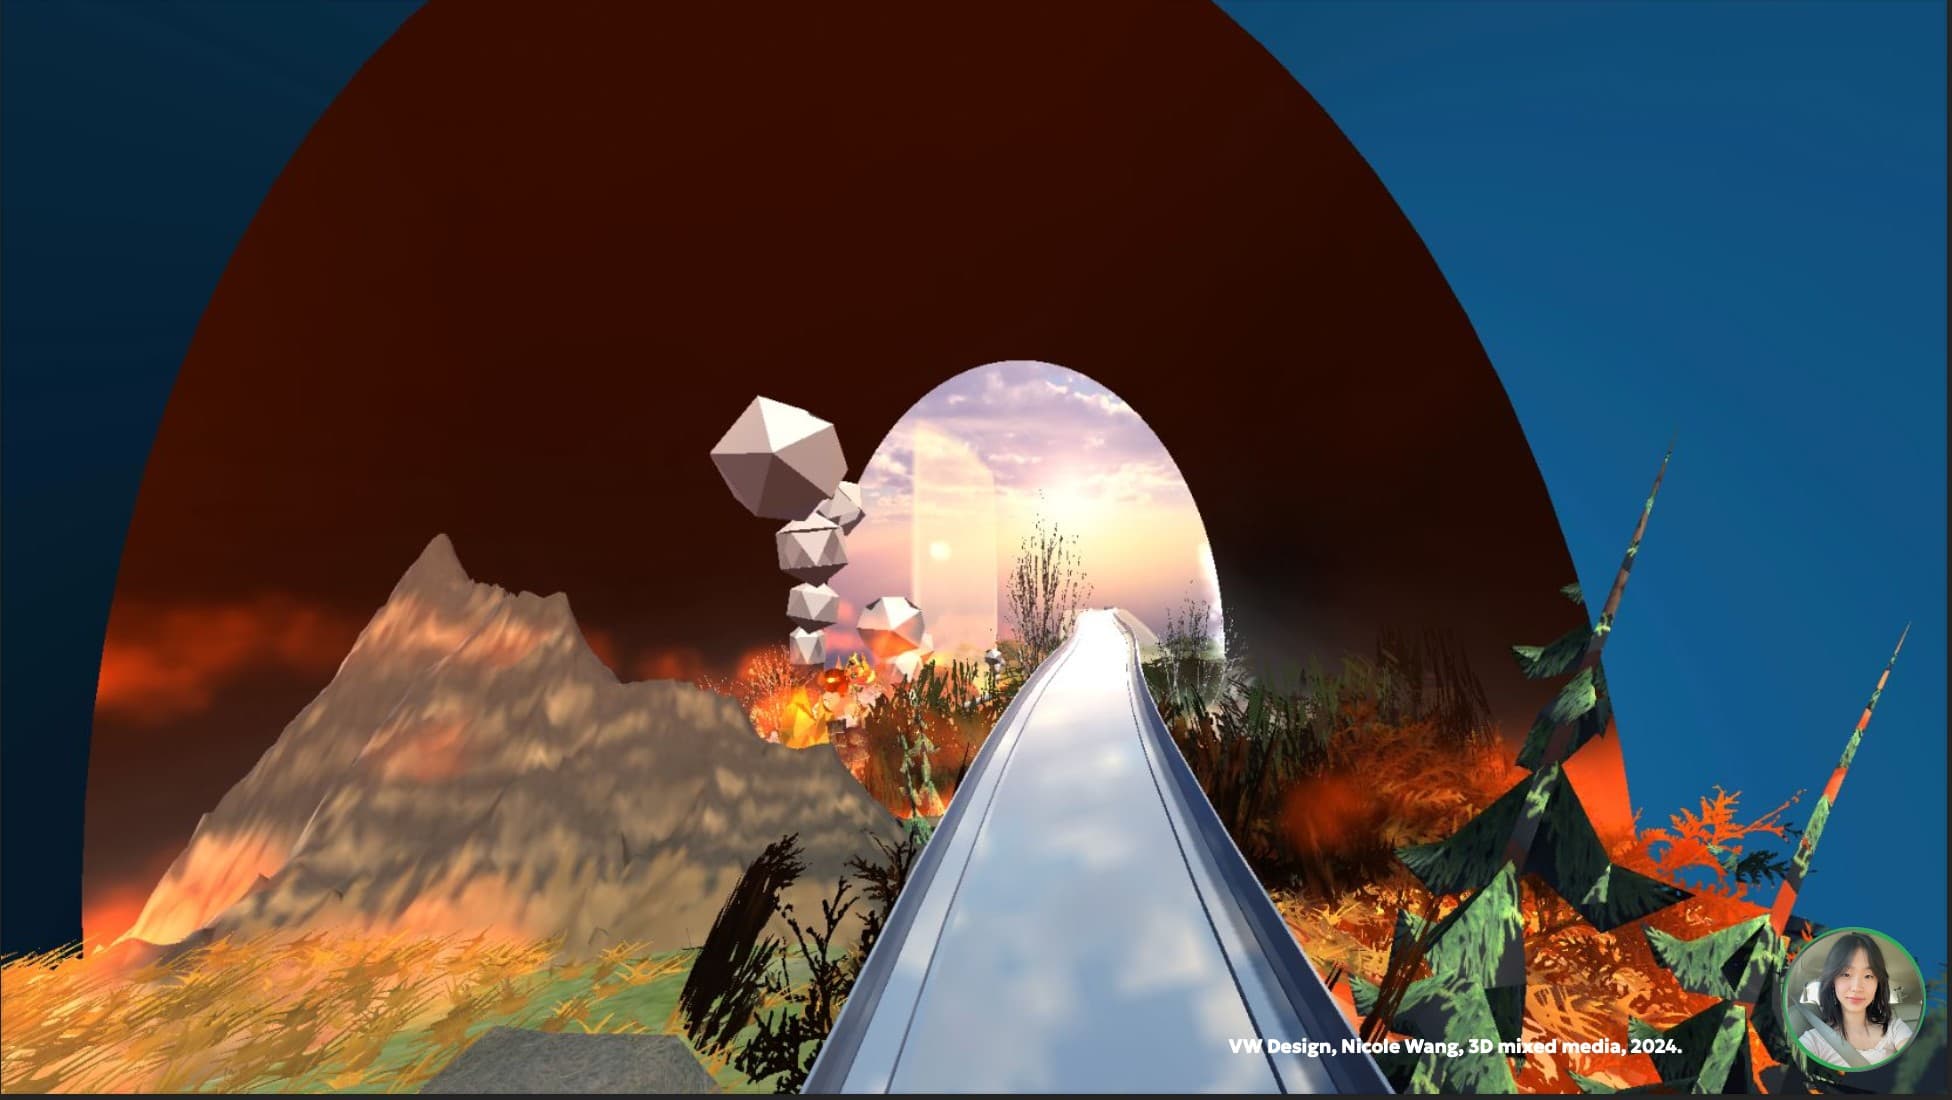
A continuous spatial story. Viewers start in clean air with green dewy grass and wildlife, pass through a transition tunnel where the environment degrades and data panels explain why, emerge into peak-season devastation (burning trees, smoke-red sky, destroyed homes), and finally reach the recovery zone where the AI system has intervened. The arc is built so understanding accumulates through movement, not reading.
Proposed AI drone detection system
The technical core of the solution. A fleet of AI-enabled UAVs equipped with multispectral, optical, and thermal cameras continuously captures imagery and environmental telemetry (temperature, humidity, wind speed, smoke density) and maintains a constant bidirectional connection to a base station. There, two parallel analyses run: AI fire-risk prediction over live conditions, and direct anomaly review of camera feeds. On a positive detection, the system holds the drone on-station and routes suppression support to its exact location, compressing the gap between ignition and response.
Embedded data + infographics
Wildfire causes, effects, and California-specific statistics are produced as in-world panels (researched, then designed in Canva) and positioned along the journey, turning the environment itself into a persuasive information layer rather than relying on a separate report.
The validation study
A pre-experience survey captured baseline understanding across five dimensions: wildfire types, prevention methods, causes, personal preparedness, and quality of existing information. After the VR experience, a parallel post-survey re-measured the same dimensions. A one-tailed paired-sample t-test (chosen for the small-sample t-distribution) quantified the shift.
Live impact
Tools & skills
The results